Weather vs Daily Activity Analysis
Statistical analysis testing whether weather predicts daily step counts. (CS 210 course project)
CS 210's project asked us to test a real hypothesis against real personal data: does weather - specifically temperature and precipitation - predict how much you walk? I used a year of my own step counts merged with Istanbul weather data (Dec 2022 - Dec 2023, 366 days, no missing values, no duplicate rows).
Exploring the data first
Before testing anything, I ran a full univariate and bivariate pass in a Jupyter notebook: histograms and box plots for step count, temperature, precipitation, and wind speed to check distributions and flag outliers, then a correlation matrix and pair plot across all four variables to see which relationships were even worth testing formally.
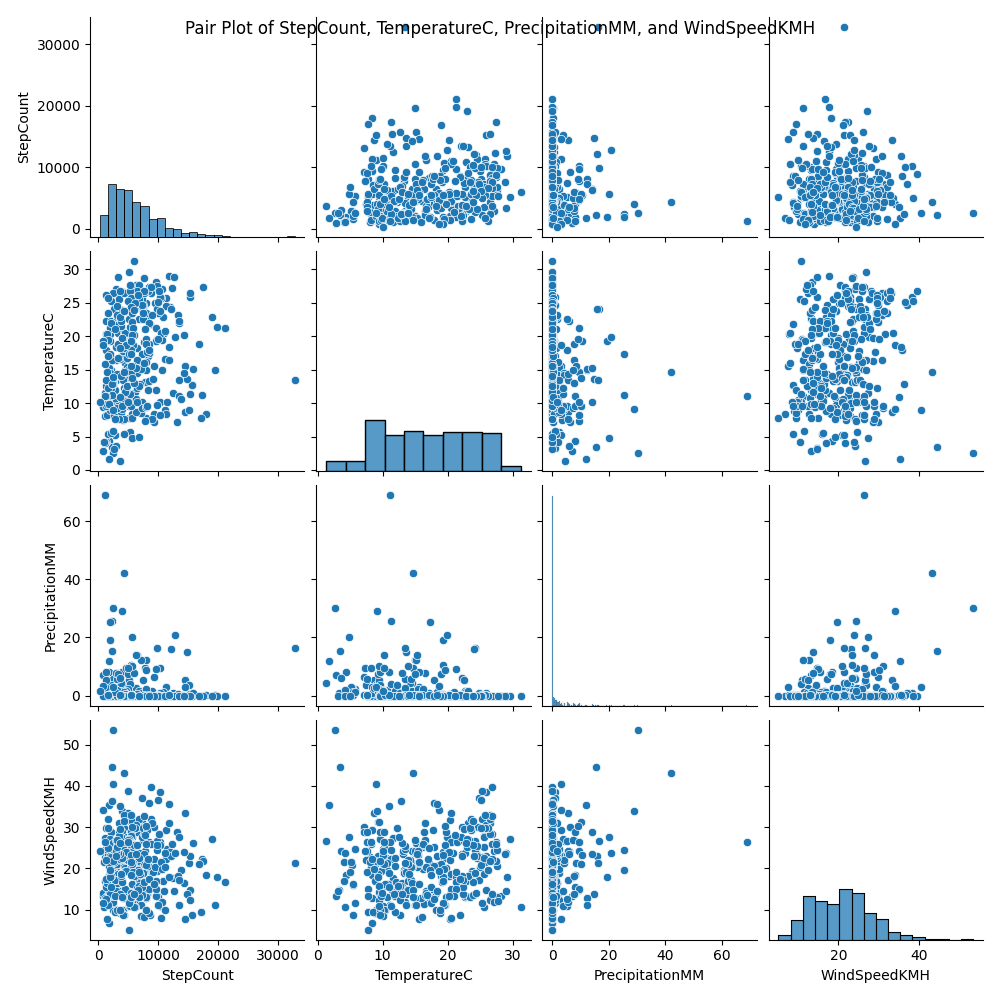
Two hypotheses, two tests
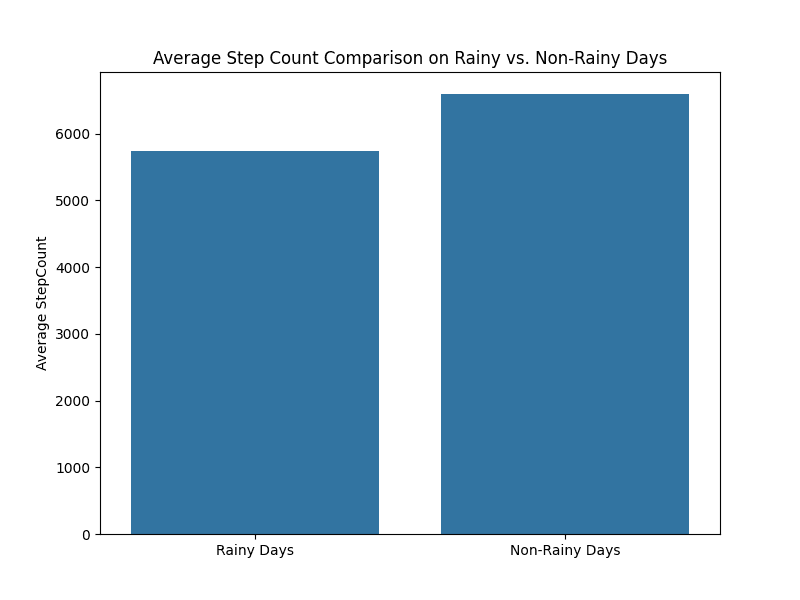
H1 - rain effect: does precipitation change how much you walk? Split into rainy vs. non-rainy days and ran a two-sample t-test (unequal variances):
from scipy.stats import ttest_ind

t_statistic, p_value = ttest_ind(
    rainy_days['StepCount'],
    non_rainy_days['StepCount'],
    equal_var=False
)
# T-Statistic: -1.93, P-Value: 0.054
At p = 0.054, just above the 0.05 cutoff, I failed to reject the null - no statistically significant difference in step count between rainy and non-rainy days.
H2 - temperature effect: does warmer weather correlate with more walking? Pearson correlation between temperature and step count:
from scipy.stats import pearsonr

correlation_coefficient, p_value = pearsonr(
    combined_df['TemperatureC'], combined_df['StepCount']
)
# r = 0.192, P-Value: 0.0002
This one was significant: a positive, if modest, correlation - warmer days meant more walking.
Flagging anomalies
Rather than trust a single method, I ran two independent anomaly detectors over the step-count series and compared what each flagged: a Z-score threshold and an Isolation Forest.
from sklearn.ensemble import IsolationForest

iso_forest = IsolationForest(contamination=0.05)
iso_forest.fit(combined_df[['StepCount']])
anomaly_predictions = iso_forest.predict(combined_df[['StepCount']])
anomalies_isoforest = combined_df[anomaly_predictions == -1]
The Z-score method flagged 5 extreme high-step days (one at 32,773 steps); Isolation Forest caught those same highs plus a run of unusually low-step days the Z-score threshold missed - a reminder that a single fixed cutoff doesn't catch anomalies at both tails equally well.
Result
No significant step-count difference between rainy and non-rainy days (p = 0.054), but a statistically significant positive correlation between temperature and step count (r = 0.192, p = 0.0002) - warmer days meant more walking, and the dataset itself checked out clean going in: no missing values, no duplicates, consistent types.